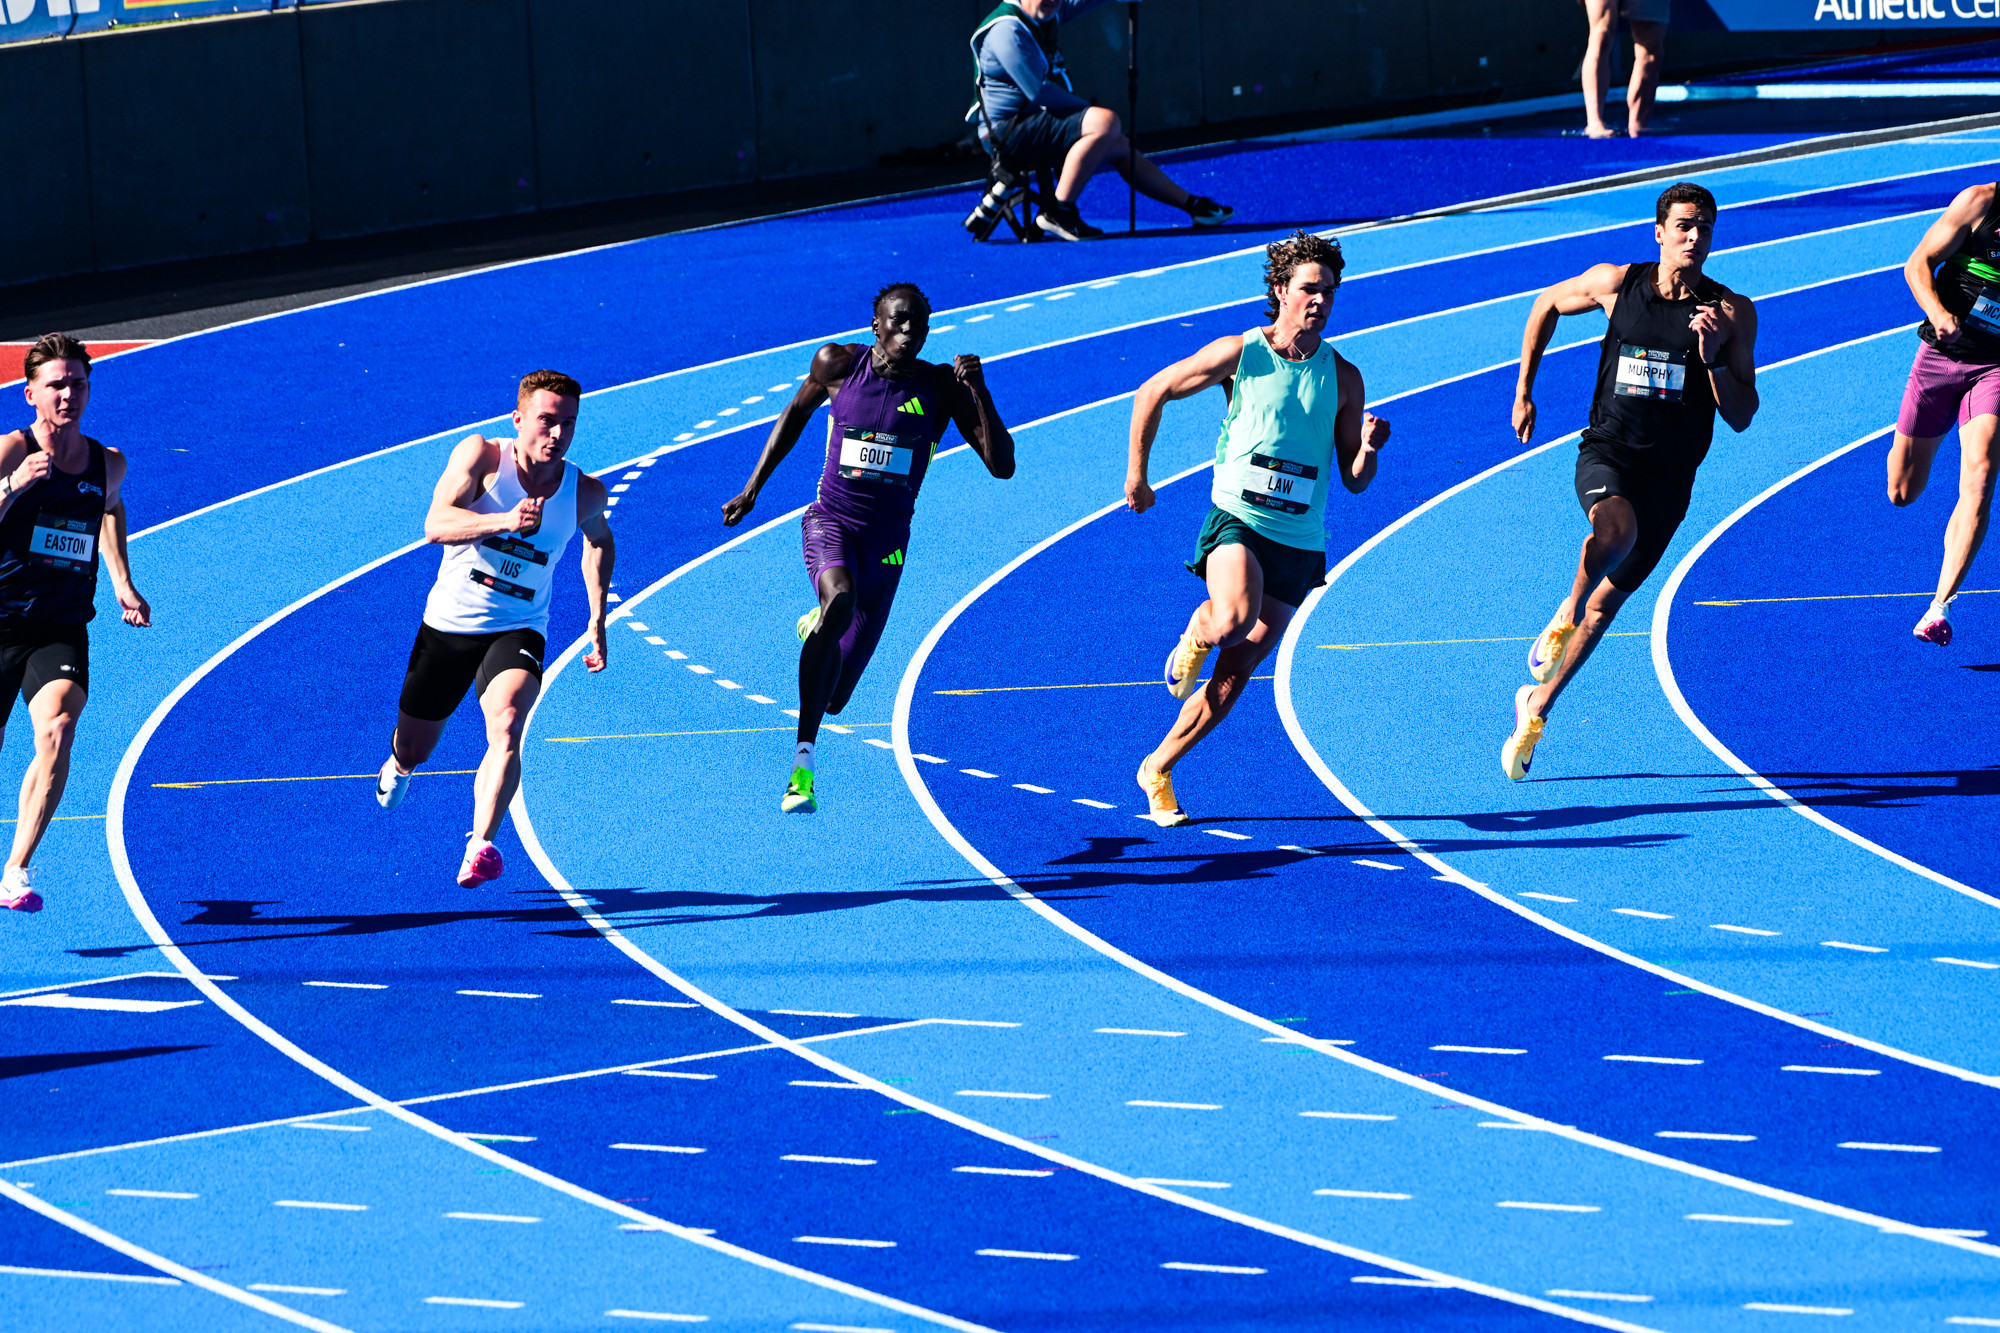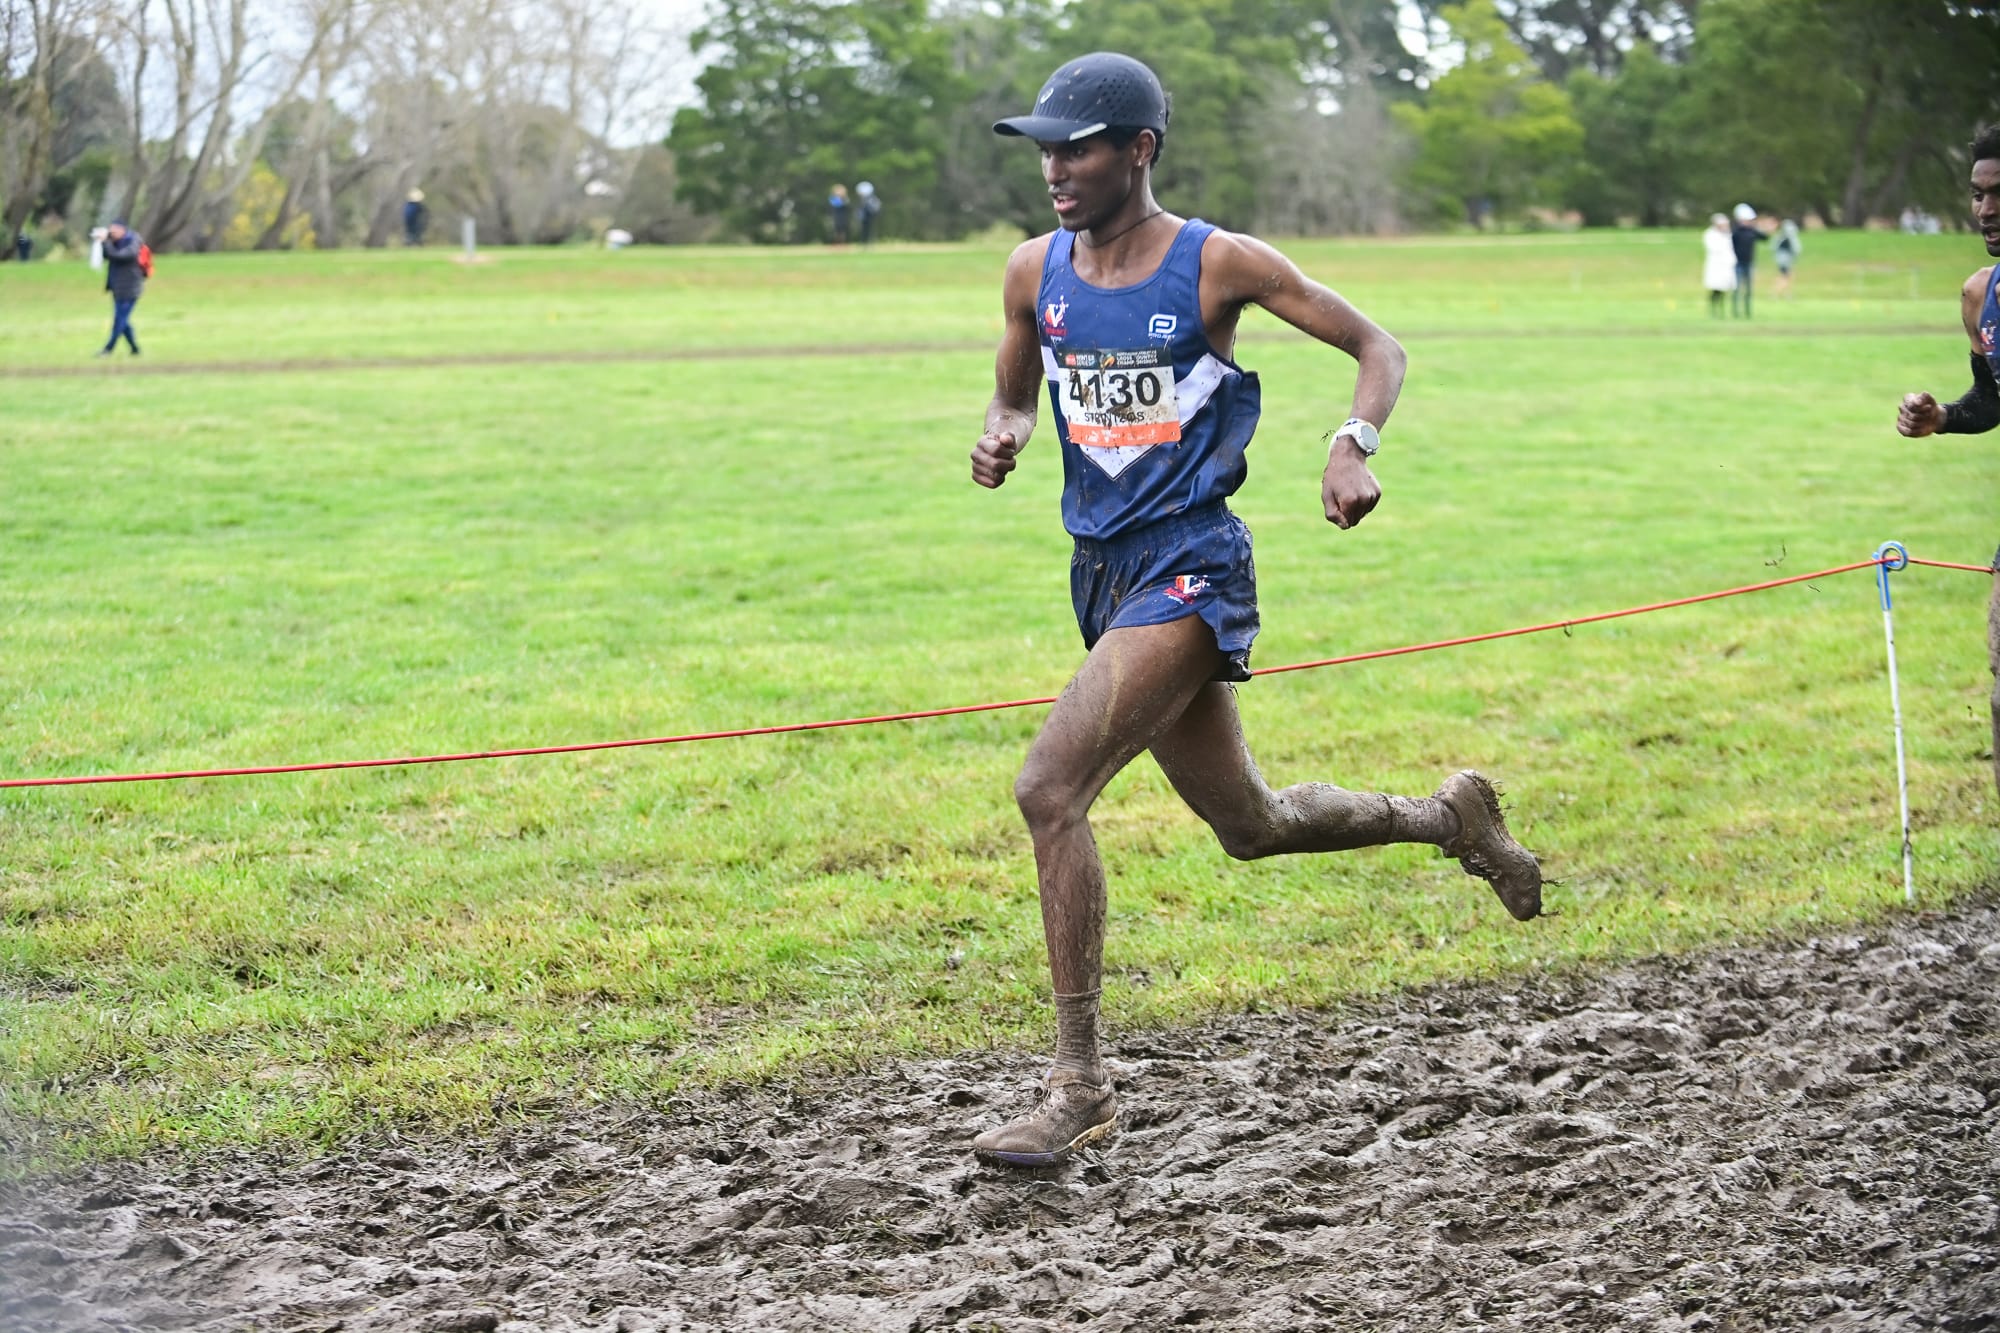

People will remember Haftu Strintzos’s win, but not his time of 32:14.
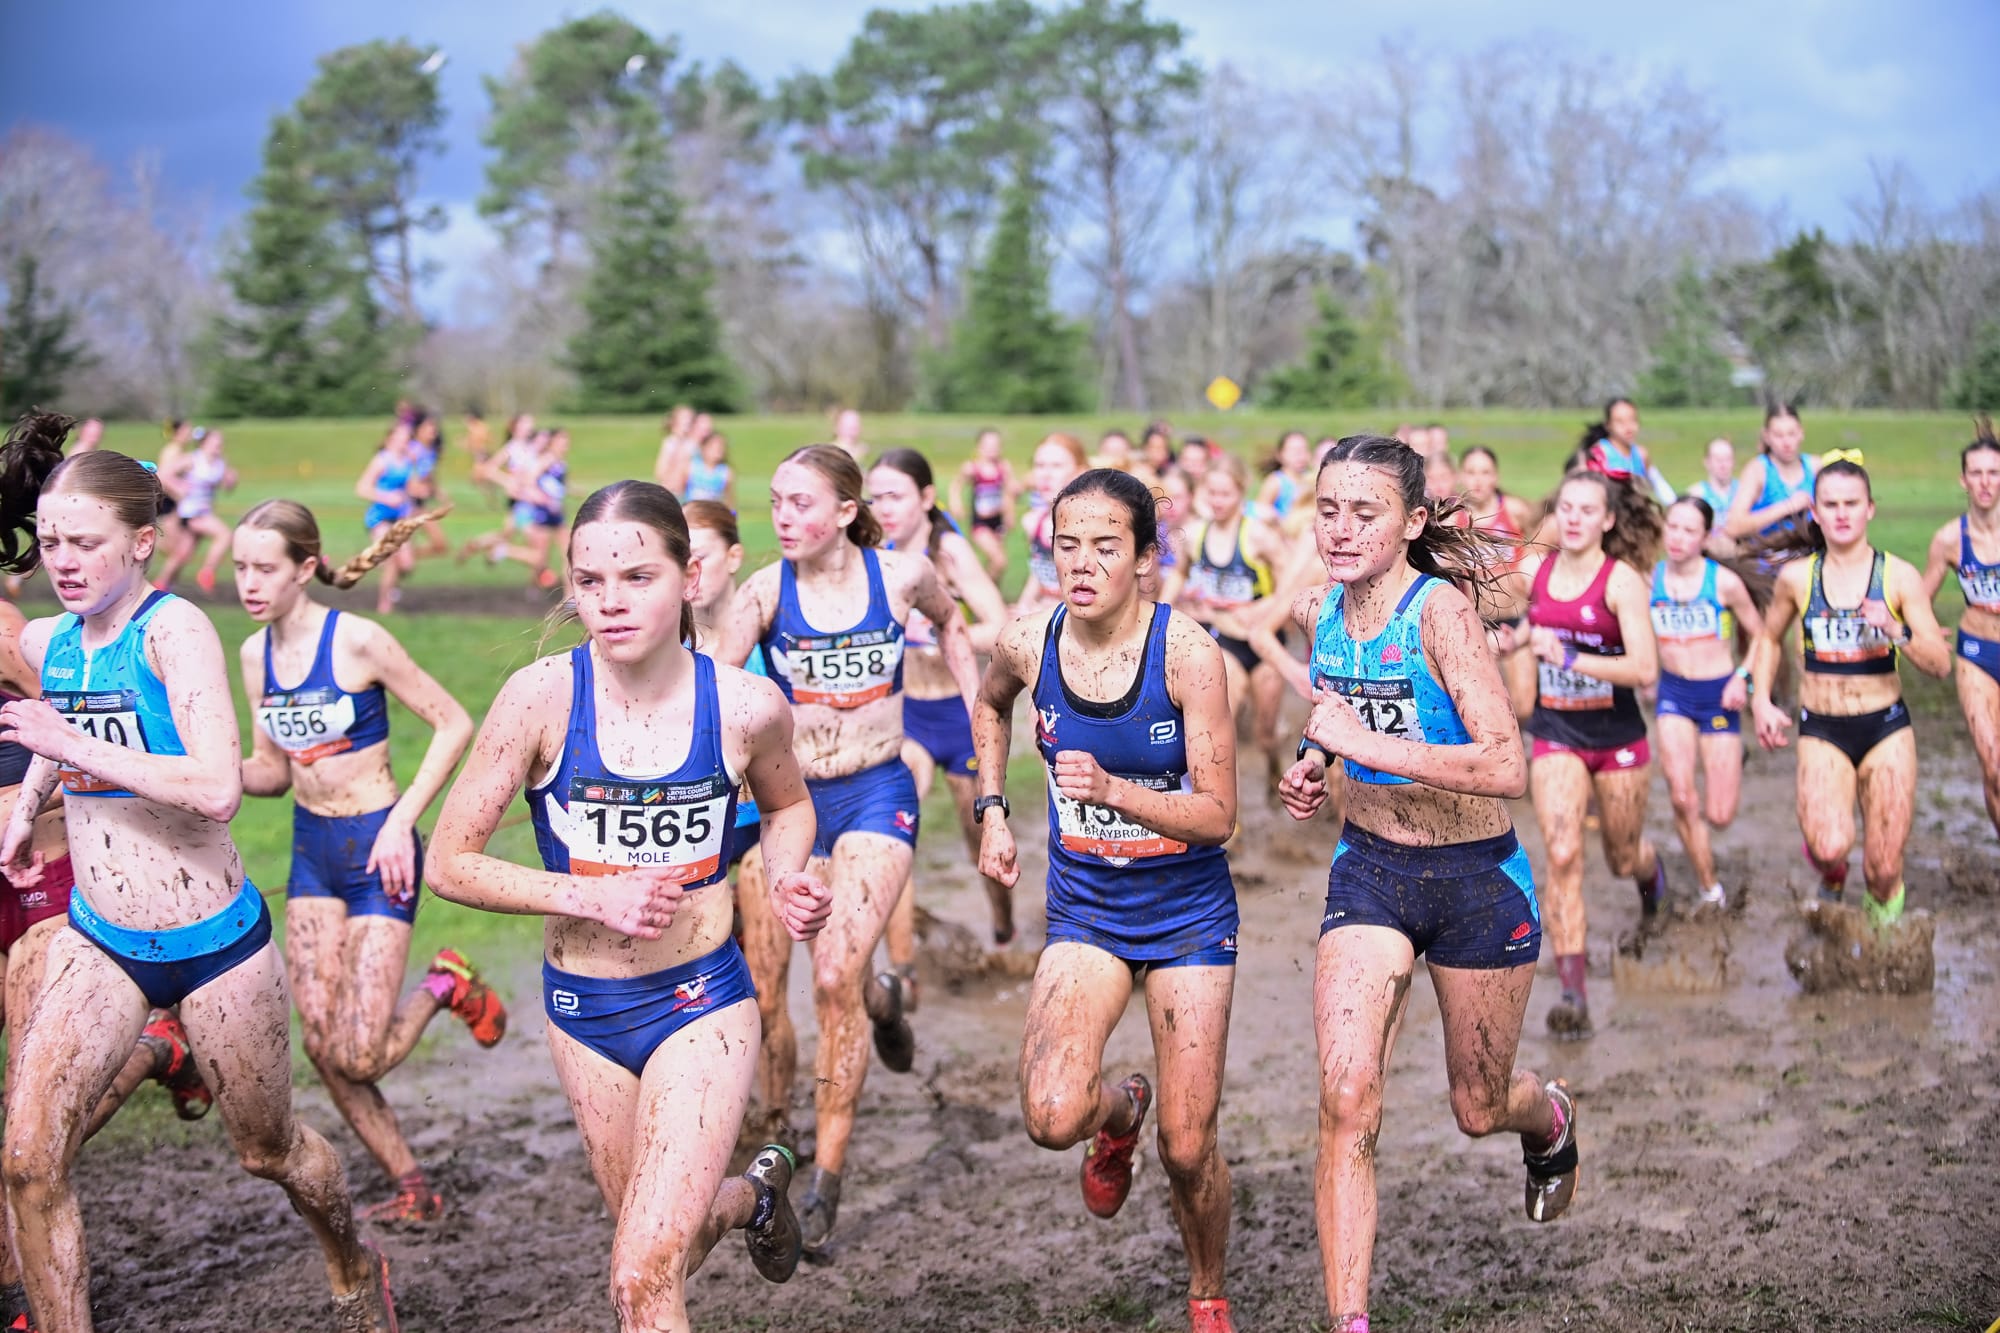
Ten kilometres in thirty-two minutes and change is a time you’d run through in training session, at well slower than the Australian record holder’s marathon pace. At Victoria Park it won a national title. The mud at Ballarat did what mud always does: it took the clock off the wall and threw it in the creek (which is what parts of the course resembled!).

Twelve months ago, on a different course with less twists and turns and little mud, Zach Facioni won this title in 30:33 and Bronte Oates won the women’s race in 34:44. This year: 32:14 and 38:18 for Holly Campbell. The men’s winning time went backwards by 1:41: five and a half per cent. The women’s went backwards by 3:34, better than ten.
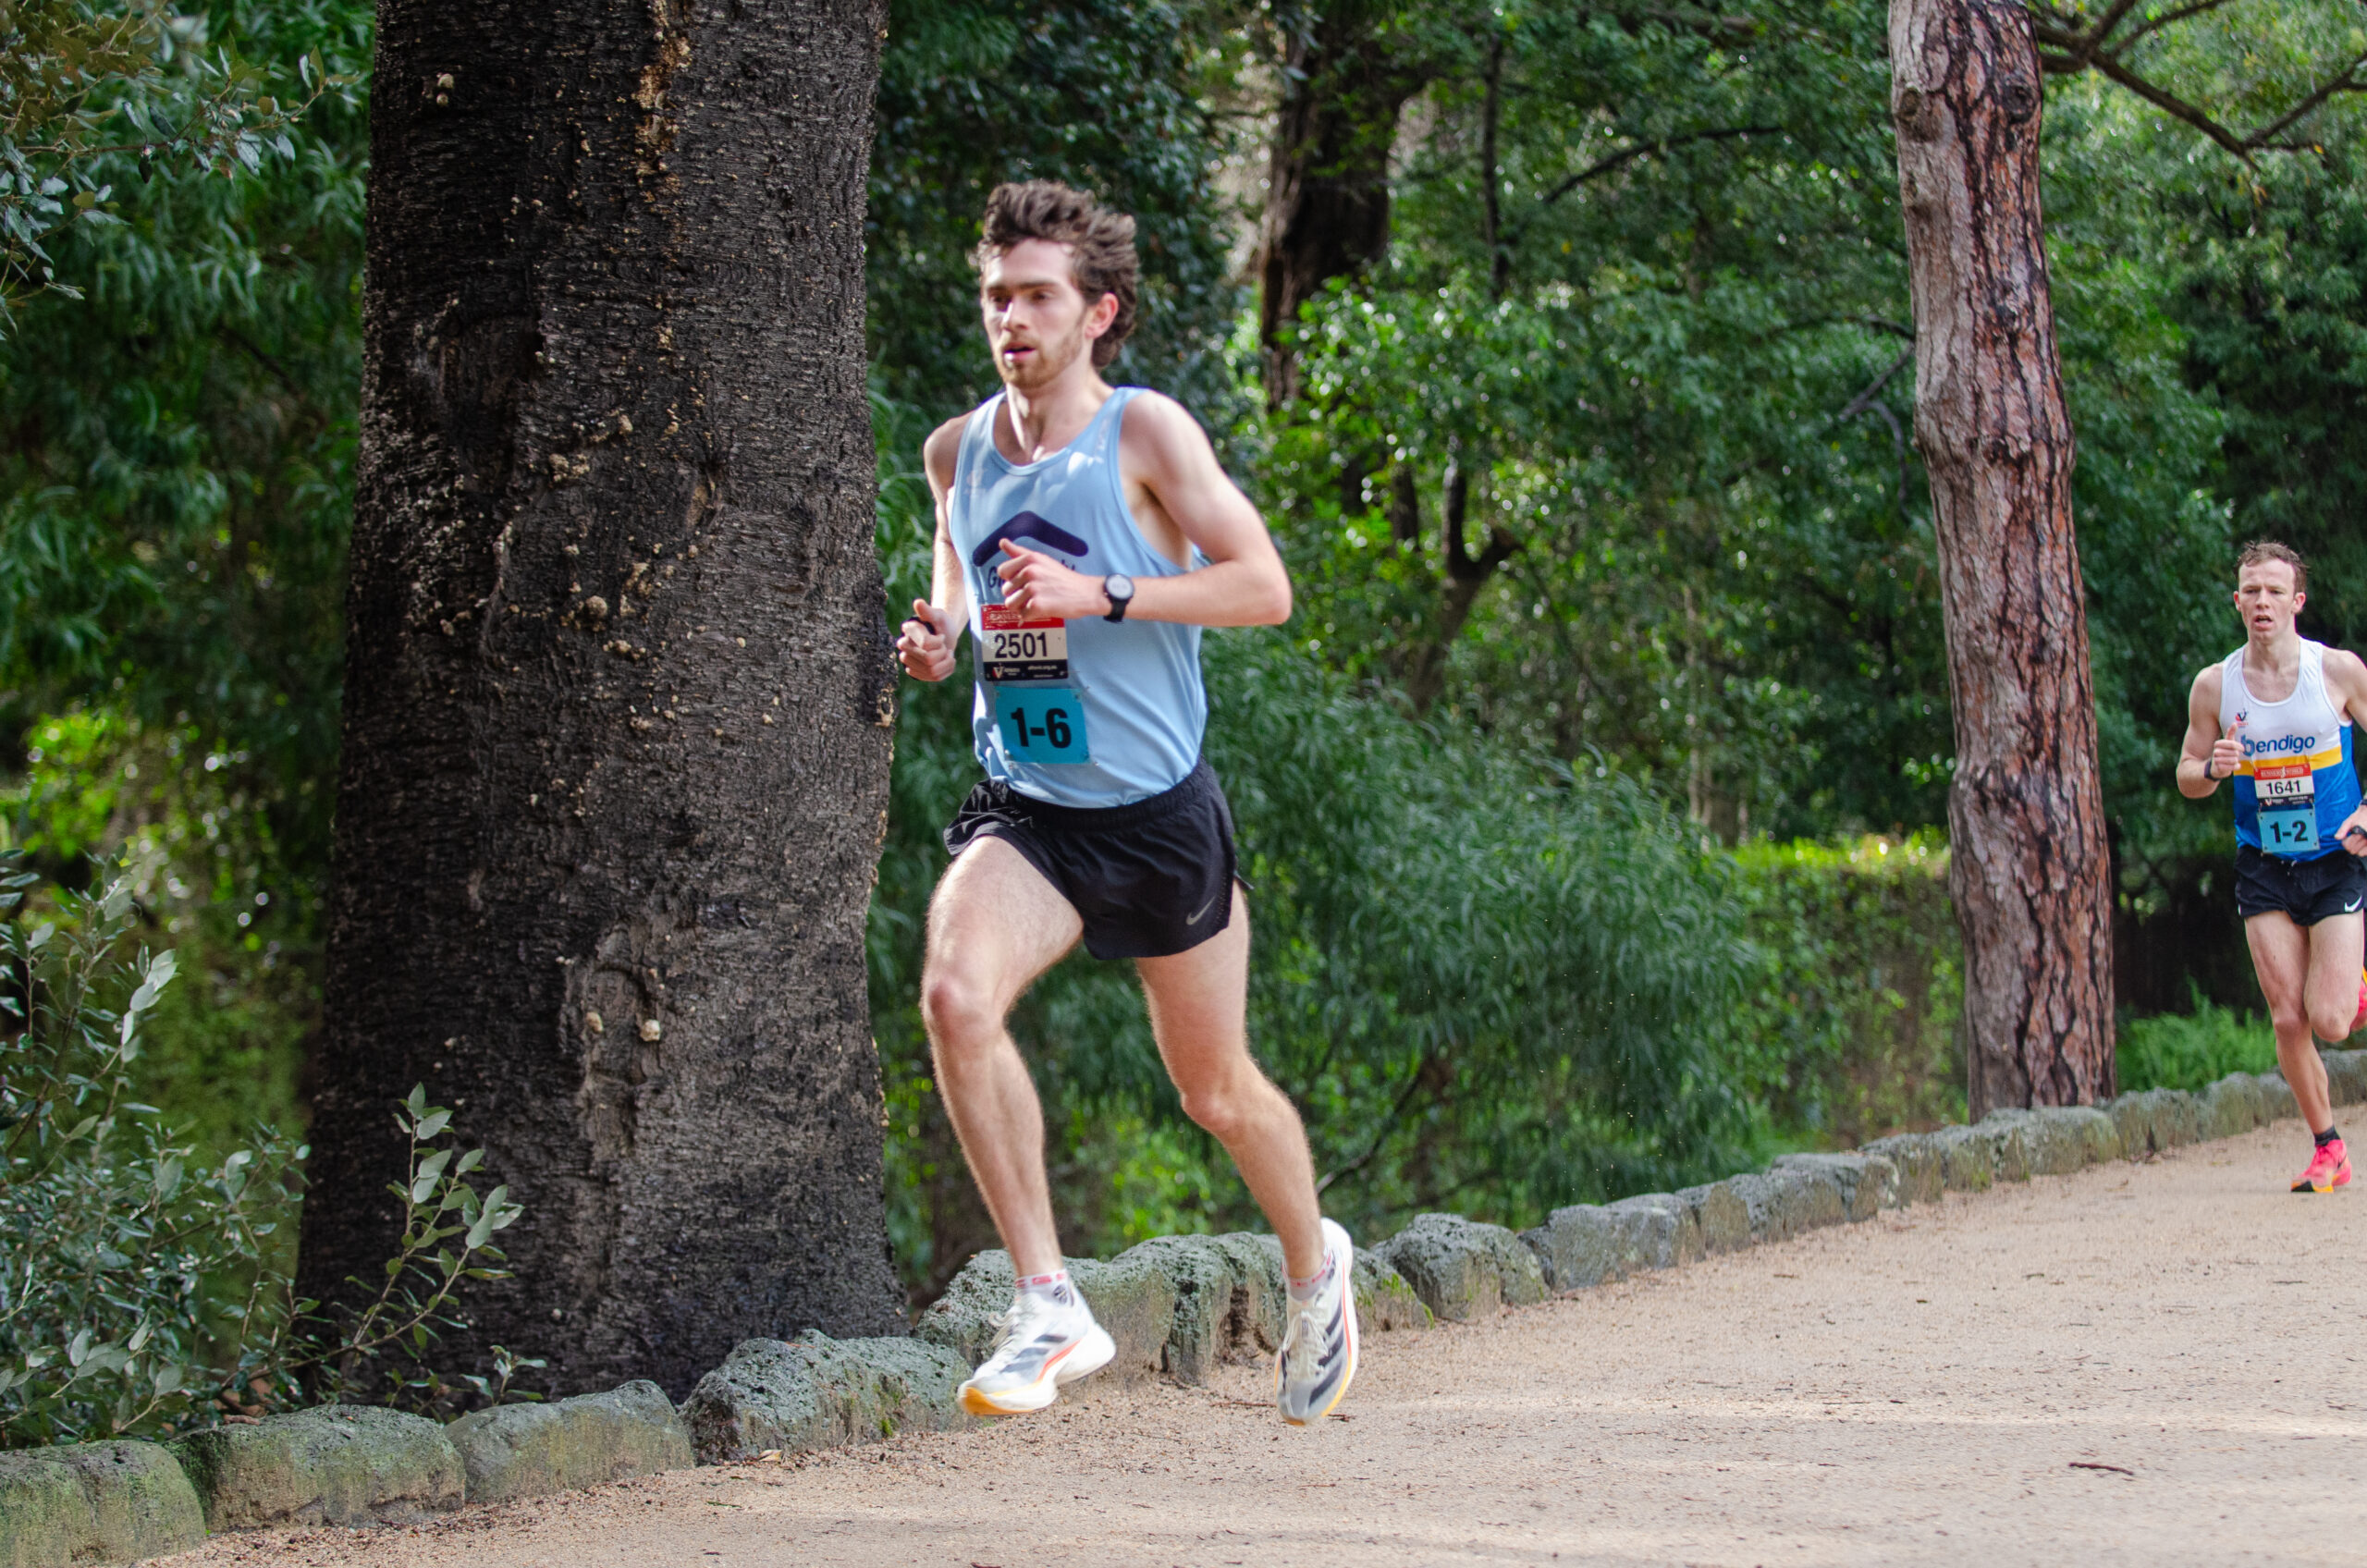
Winner-to-winner is a rough measure, though, because winners change. The sharper version is the same athlete running the same event over two different pieces of ground. Isabella Valinoti won the U20 women’s 6km last year in 20:52. At Ballarat she finished second in 23:52 — three minutes slower, more than fourteen per cent, over an identical distance. Matthew Buckell was third in the open men’s race last year in 30:58; this year he was seventh in 33:34, two and a half minutes adrift of himself.
Nobody got worse. The ground did.
But something else happened at Victoria Park. Timing mats sat at 1.9km and every two kilometres after it, on every lap, in every race. Twelve championship races. What those mats recorded is a far better record of the day than any finishing time — because once the conditions strip the times of meaning, what’s left is the racing.
Here is Ballarat by the numbers.
6:22
The width of a national title.
The men’s 10km looked, from the fence, like a two-man race that went to the wire. The splits say it was two separate races stacked on top of each other.
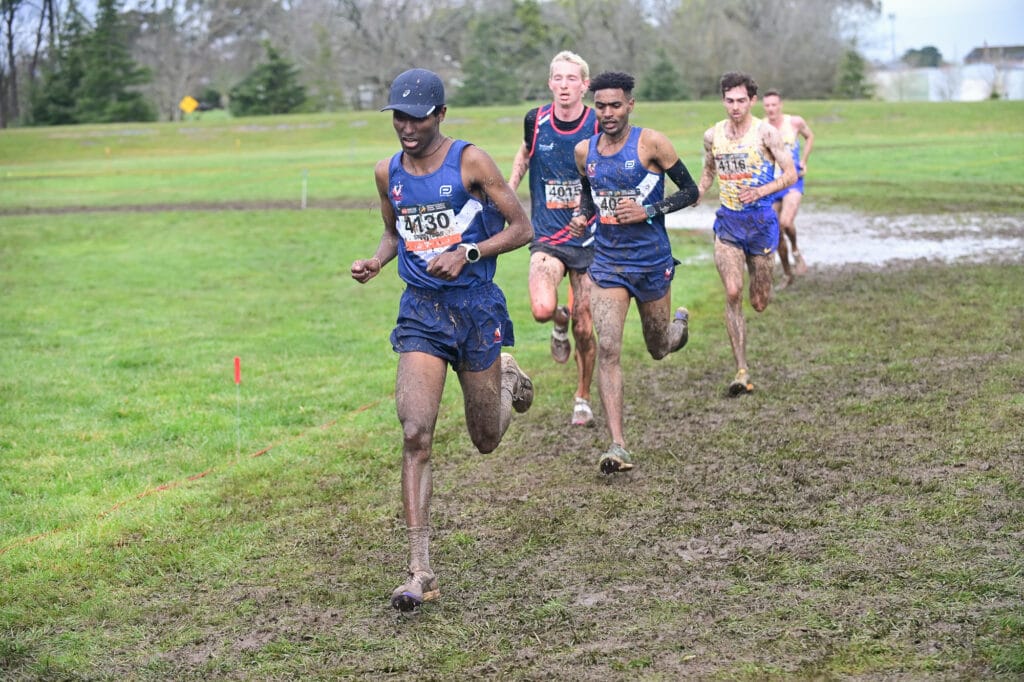
The first was settled on the third loop. Strintzos ran 6:22 for the 3.9–5.9km segment — the fastest 2km anyone covered in that race all day. Ed Marks ran 6:29, Luke Hince 6:27, Matt Ramsden 6:34. Marks would finish nine seconds behind. Seven of those nine were lost right there, on one loop, in the middle of the race, and on the evidence of the splits he was never in a position to get them back.
The second race was still going. Yohanes Asmare, the 19-year-old Ethiopian who took the U20 men’s title at these championships a year ago, went with Strintzos and stayed.
25:23
The two of them hit the 7.9km mat on exactly the same second. Not within a second — on it.
What settled the title was the last full loop and most of it over the final kilometre, 6:32 to 6:35, and then 19 seconds to 22 over the run-in. Six seconds after 10,000 metres of Ballarat mud.
The four-second swing on that closing loop is worth sitting with. Strintzos ran it two seconds faster than his previous lap. Asmare ran it two seconds slower. On the only piece of ground where it still mattered, one of them was still accelerating and the other had stopped.
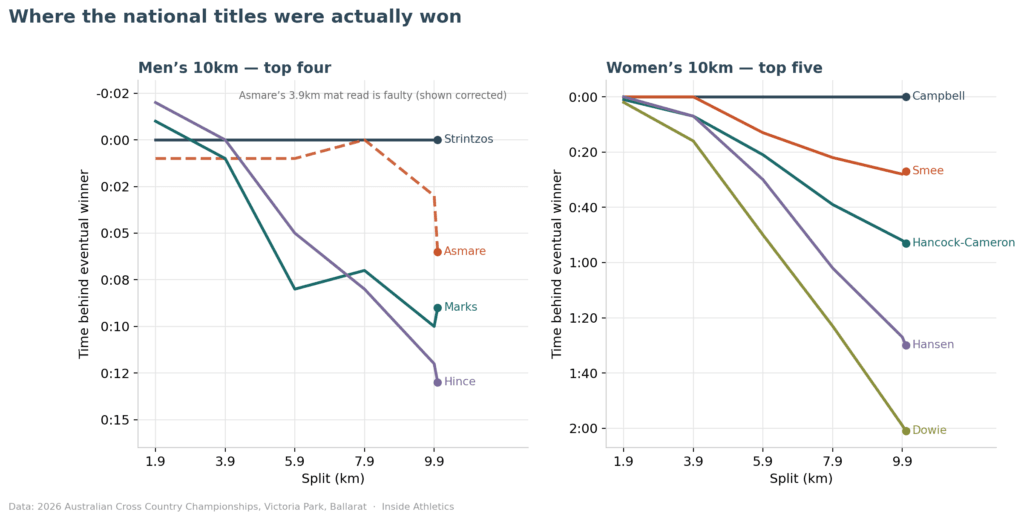
Gap to the eventual winner at each timing mat. Asmare’s 3.9km read is faulty and shown corrected.
7:32
The women’s race was the opposite shape and just as clear.
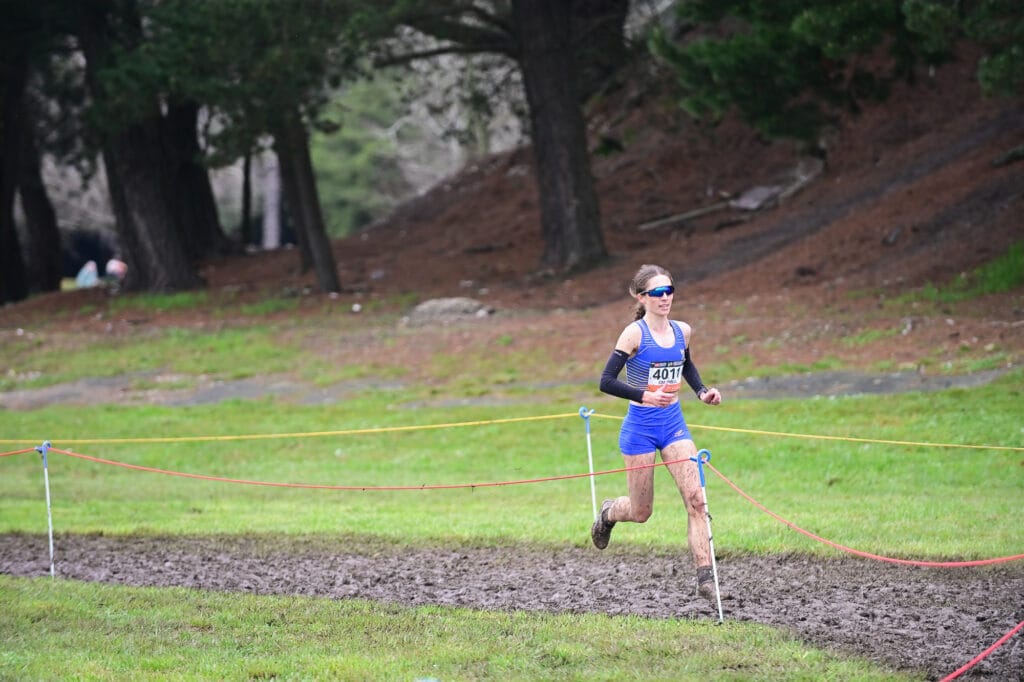
Holly Campbell and Ruby Smee were also inseparable early — both through 3.9km in 14:58, identical to the second. Then Campbell ran 7:32 for the third loop. It was the fastest 2km run by any woman in the race, it turned into a thirteen-second lead, and she never ran that fast again. 7:41, then 7:44, and a 27-second win.
Set the four championship winners against their own averages and Campbell stands alone.
She is the only one of the four who opened slower than her own average — 0.8% down — and then produced her quickest lap of the day in the middle of the race. That’s the story of a dominant win: held in reserve, spent in one place. Strintzos ran the mirror image, three laps under his average and then two above it, holding on better than others.
70%
Here is the finding that surprised me most.
You would expect a course deteriorating under a hundred pairs of spikes and tired legs to produce its slowest lap last in the men’s and women’s races. It didn’t. Compare every athlete’s final full 2km lap against their penultimate one and the great majority got quicker:
- Open men: 54 of 77 ran a faster final lap (70.1%). Twenty were slower (26.0%), three identical.
- Open women: 31 of 46 ran a faster final lap (67.4%). Thirteen were slower (28.3%), two identical.
The penultimate lap — 5.9 to 7.9km — was the slowest of an athlete’s four laps for 66% of the men’s field and 54% of the women’s. The final lap was the slowest for only 27% and 28%.
The whole-of-field averages say the same thing: 7:20, 7:27, 7:36, 7:31 for the senior men, and 8:56, 9:10, 9:18, 9:13 for the senior women.
Normalise every race against its own even-pace benchmark and the shape is nearly identical everywhere:
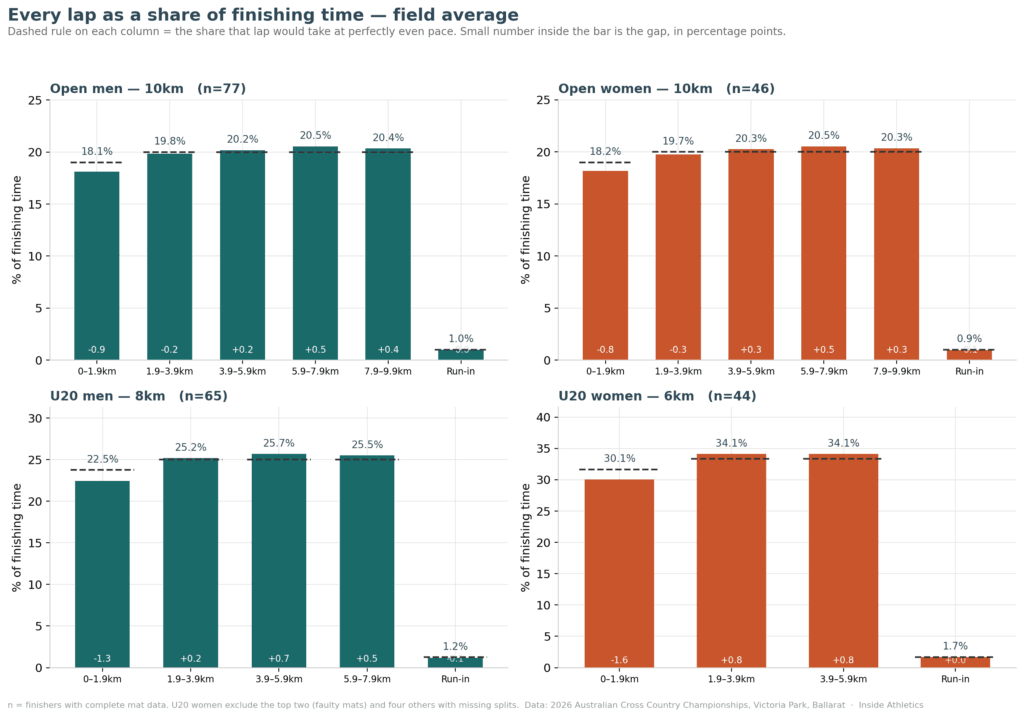
Fast opening, second lap still fractionally under even pace, a steady climb to a peak on the penultimate loop, then a recovery. That is a field racing the finish rather than surviving it, on ground getting worse by the minute.
7 of 10
And now the exception, which is the more interesting number.
The front of the men’s race did the opposite of the field. Seven of the top ten ran a slower final lap: Asmare, Marks, Ramsden, Janetzki, Millar, Cashin and Clarke all lost time. Only Strintzos, Hince and Buckell gained. Against a field rate of 26%, seven from ten is roughly a one-in-two-hundred outcome by chance, though it is ten athletes, so take it as suggestive rather than settled.
Go down the finishing order and the pattern is stark:
| Finishing positions | Ran a slower final lap | Mean swing |
|---|---|---|
| 1–10 | 7 of 10 (70%) | 3sec slower |
| 11–20 | 3 of 10 (30%) | 1sec faster |
| 21–30 | 0 of 10 (0%) | 12sec faster |
| 31–40 | 2 of 10 (20%) | 5sec faster |
| 41–77 | 8 of 37 (22%) | 5sec faster |
Nobody in the 21st-to-30th bracket slowed down. Not one. They averaged twelve seconds quicker over the closing loop than the one before it.
Read together, that looks like a race in which the medal contenders genuinely emptied themselves on the third loop and everybody behind them ran a controlled effort with something in hand. Whether that’s a criticism or simply what a championship looks like is a question for coaches, not for a spreadsheet.
The women’s top ten went the other way. Only three slowed — Campbell three seconds, Katherine Dowie six, Brielle Erbacher ten — and Bridget Lunn produced the biggest positive swing in the top twenty, eighteen seconds quicker on her closing lap on the way to eighth.
1:50 v 3:38
Strip the times away and compare the shape of the fields instead.
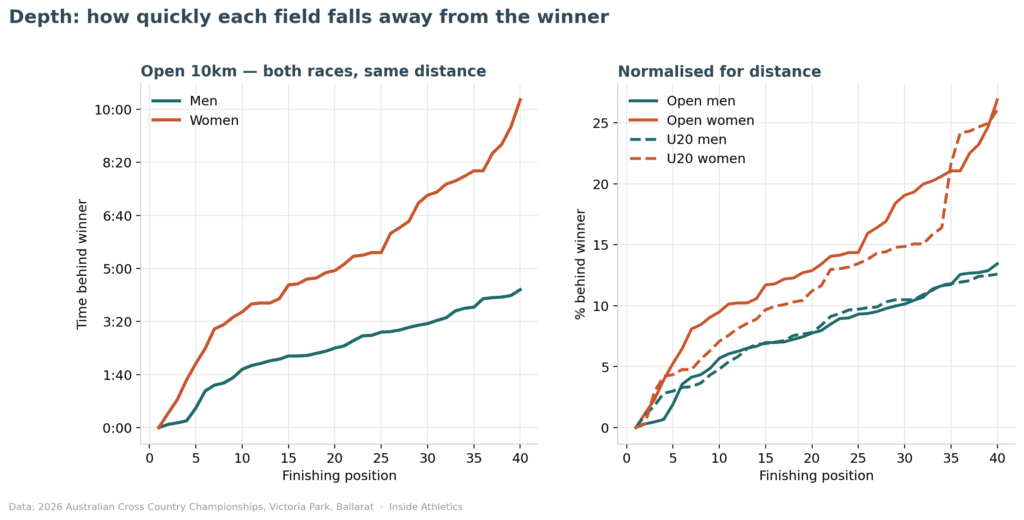
The senior men’s top ten was covered by 1:50 and the top twenty by 2:30. Twenty-two men broke 35:00; thirty-four broke 36:00. The senior women’s top ten spread over 3:38 and the top twenty over 4:56, with four women under 40:00.
That isn’t a criticism of the athletes at the front of the women’s race. Campbell, Smee and Jaylah Hancock-Cameron ran a genuine championship. It’s an observation about what sits behind them, and it points straight at the second half of this story.
38 of 77
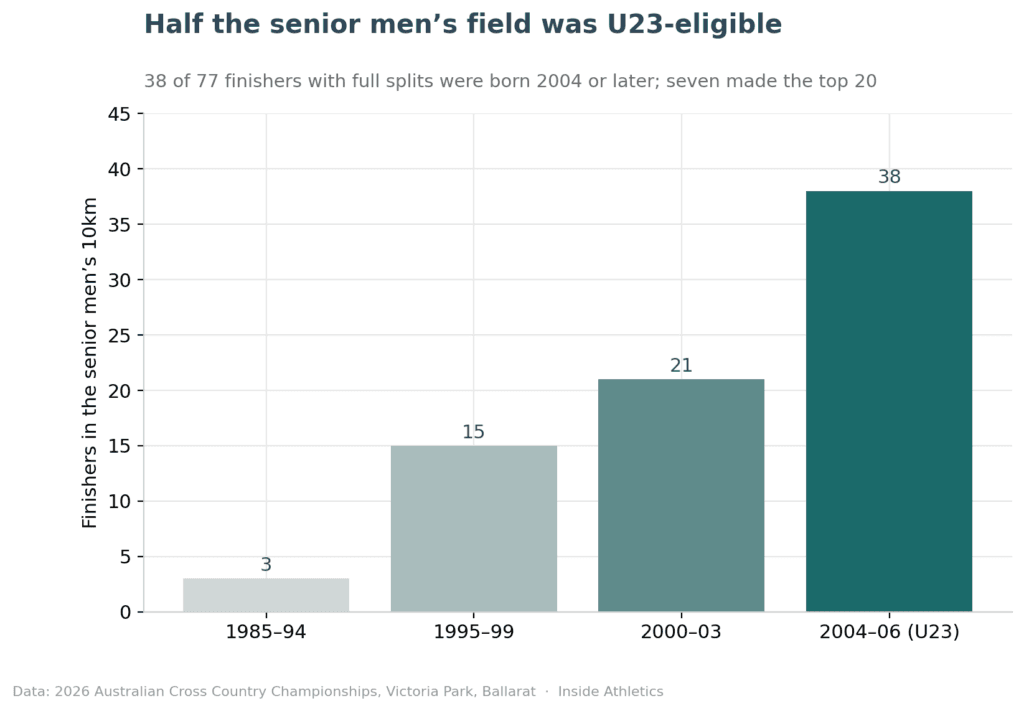
Thirty-eight of the seventy-seven men – 49% – were born in 2004 or later. Seven made the top twenty. Asmare took second outright; the fastest Australian U23 was Logan Janetzki, sixth in 33:23. On the women’s side it was thirteen of forty-six – 28% – led by Olivia Sivills in seventh.
The U23 championship isn’t a support act at these championships. It’s half of the senior men’s race, and a missing segment in the women’s.
15:09, 15:09, 15:39, 15:57
Because every race ran the same loops on the same afternoon, the 3.9km mat offers something rare: a like-for-like comparison of every age group and both sexes, on identical ground, in identical conditions.
Now hold the distance constant. All four girls’ age groups raced exactly 4km. Their times go backwards with age.
Winners: 15:09 at U15, 15:09 at U16, 15:39 at U17, 15:57 at U18. Tenth place: 16:12, 16:35, 16:52, 16:48. Median: 17:17, 17:38, 17:53, 17:44.
The boys’ median opening 1.9km — the one segment every single race covered — goes 7:19, 7:08, 7:02, 6:52. Straight down, year on year, exactly as you’d expect. The girls’ goes 7:58, 8:08, 8:08, 8:02.
Of course, they were different races under championship conditions, and its not an uncommon outcome of physiology, with puberty affecting girls differently to boys.
From 106% to 59%
Then the entries follow.
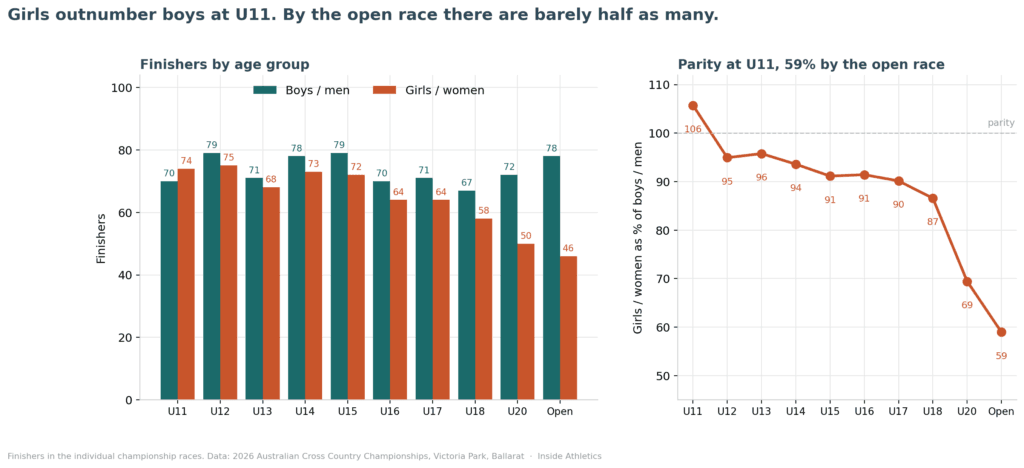
The U11 and U12 girls age groups had 40% more participants than the prior years, and more girls than boys compete in the youngest age group. There’s then a slow decline followed by falling off the cliff at U20s and going further south in the opens.
2, 3, 3, 4, 4, 4, 4, 6, 10
And here is where the cliff sits.
Boys and Girls race the same distances from U11 to U16, before splitting off. U17 and U18 men run 6km, U20s 8km. The U17 and U18 women run the same 4km distance they have for the prior two years, then step up to 6km in U20 and 10km in opens.
The 10km distance for opens aligns with the international standard for the World Cross Country, which was normalised between genders in 2017 (having previously been 12km and 8km). However, the U20 international distances remained the same, at 8km or 6km.
Girls hold at four kilometres for four consecutive age groups, then step to six, then to ten. A girl goes from a 4km championship at seventeen to a 10km championship at twenty. The largest single step a boy makes is 6km to 8km then 8km to 10km.
Correlation is not cause, and this is analysis rather than verdict.
6:59
The performance of the junior day.
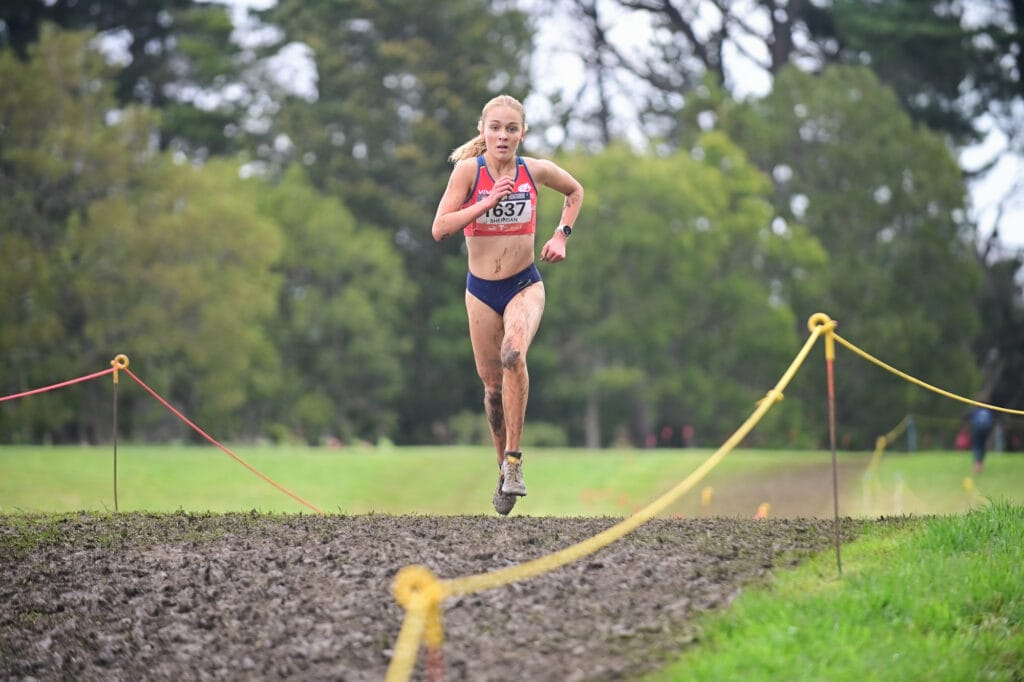
Amelia Sheridan won the U16 girls’ 4km by thirty-eight seconds, and her opening 1.9km of 6:59 was the only sub-7:00 start loop by any girl at any age group. Dropped into the U16 boys’ race she’d have been 27th at 1.9km and 24th at the finish.
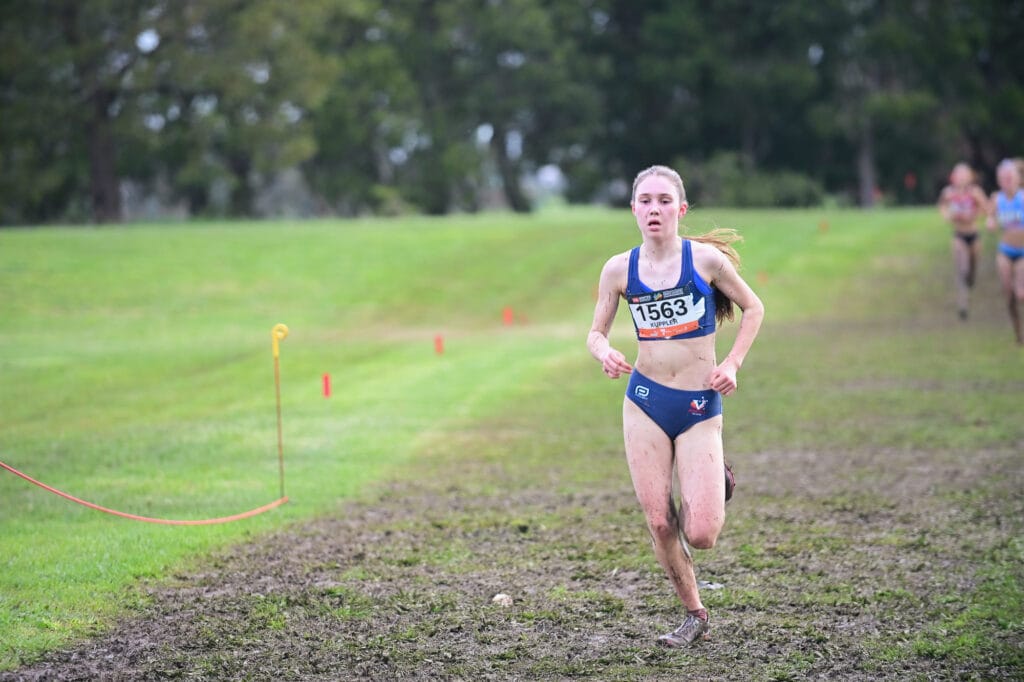
Heidi Kuppler ran the fastest 2km loop of any junior girl at any age — 7:34 in the U15 race, quicker than the U16, U17 and U18 winners managed. Against the U15 boys, that loop ranked eighth of seventy-nine.
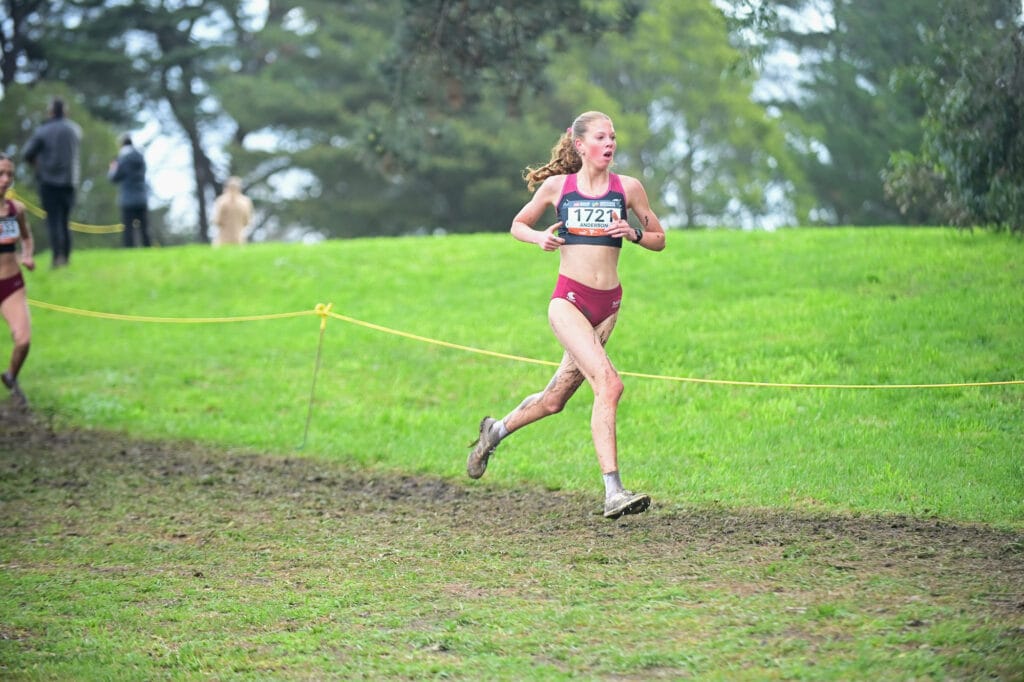
Piper Anderson produced the most dominant single segment of the meet: 7:38 in the U17 girls’ race, thirty-three seconds faster than anyone else in the field in her race.
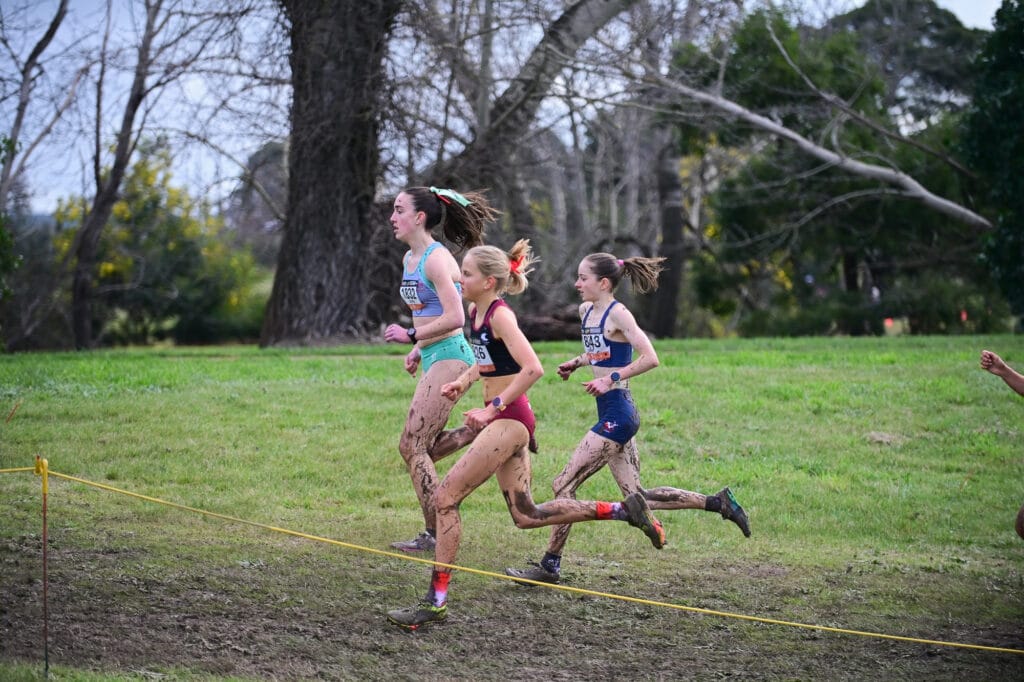
Mia Gray won the U18 girls’ race tactically. The top nine went through 1.9km covered by three seconds; Gray was then the only athlete in the field to break 8:00 for the closing loop.
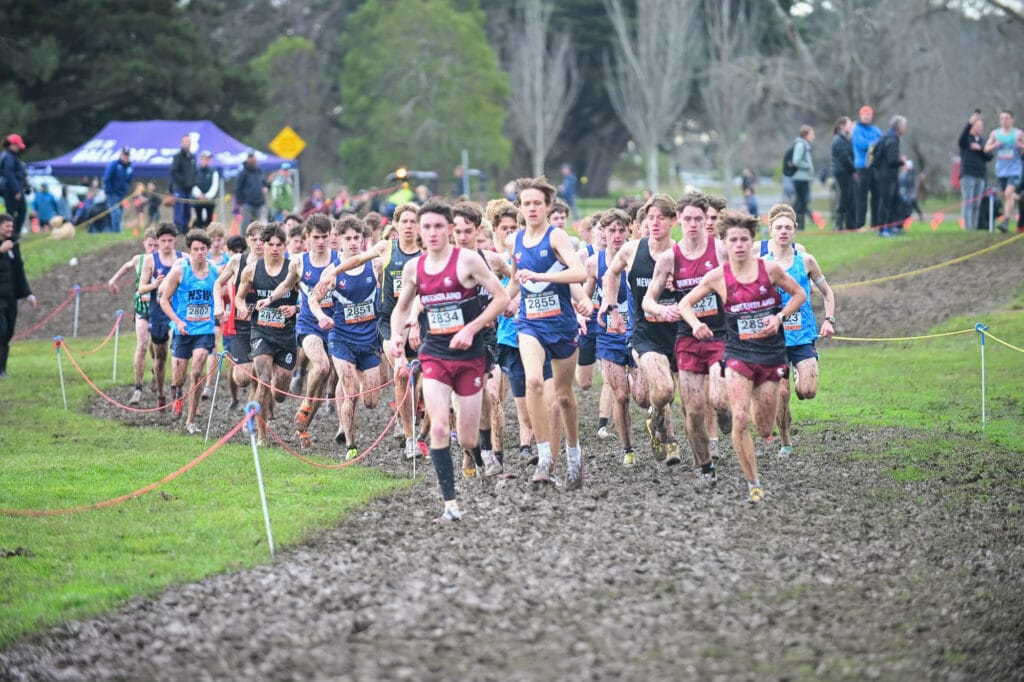
The U18 boys 6km had the tightest front pack of the championships — twelve athletes through 1.9km within two seconds. Finn Kane then ran the only genuinely aggressive close in the race, 7:03 into 6:51, and won it.
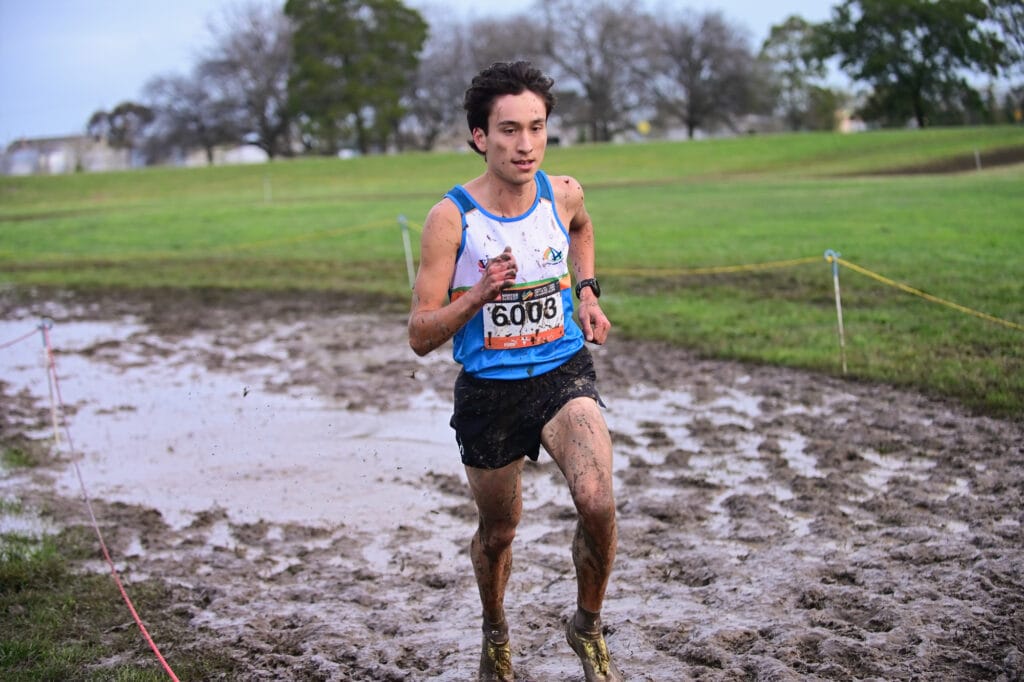
Lucas Chis won the U20 men’s 8km from the front with a surge and made sure he didn’t pay for it. His second loop of 6:43 was the fastest in that race by fourteen seconds, and only eleven of the seventy-seven senior men ran a quicker 2km all afternoon. He then drifted — 7:03, 7:09 — but still won by seventeen seconds. His 7.9km split of 27:25 would have placed him twentieth in the senior men’s race at the same point.
Corban Holmes is the cautionary version. Level with Harrison Boyn in second at 3.9km, then 7:18 and 8:25. He lost 1:28 on his own previous lap and dropped from third to thirteenth: the biggest single-lap collapse recorded anywhere on the day.
What the mats got wrong
Four things, because they matter if you’re reading the raw data yourself.
Asmare’s 3.9km split of 13:05 is impossible. It implies a 7:01 loop followed by a 5:45 loop — more than thirty seconds a lap faster than anything else recorded on the day. It is a late mat read of roughly thirty-five seconds; every other split of his says he was level with Strintzos.
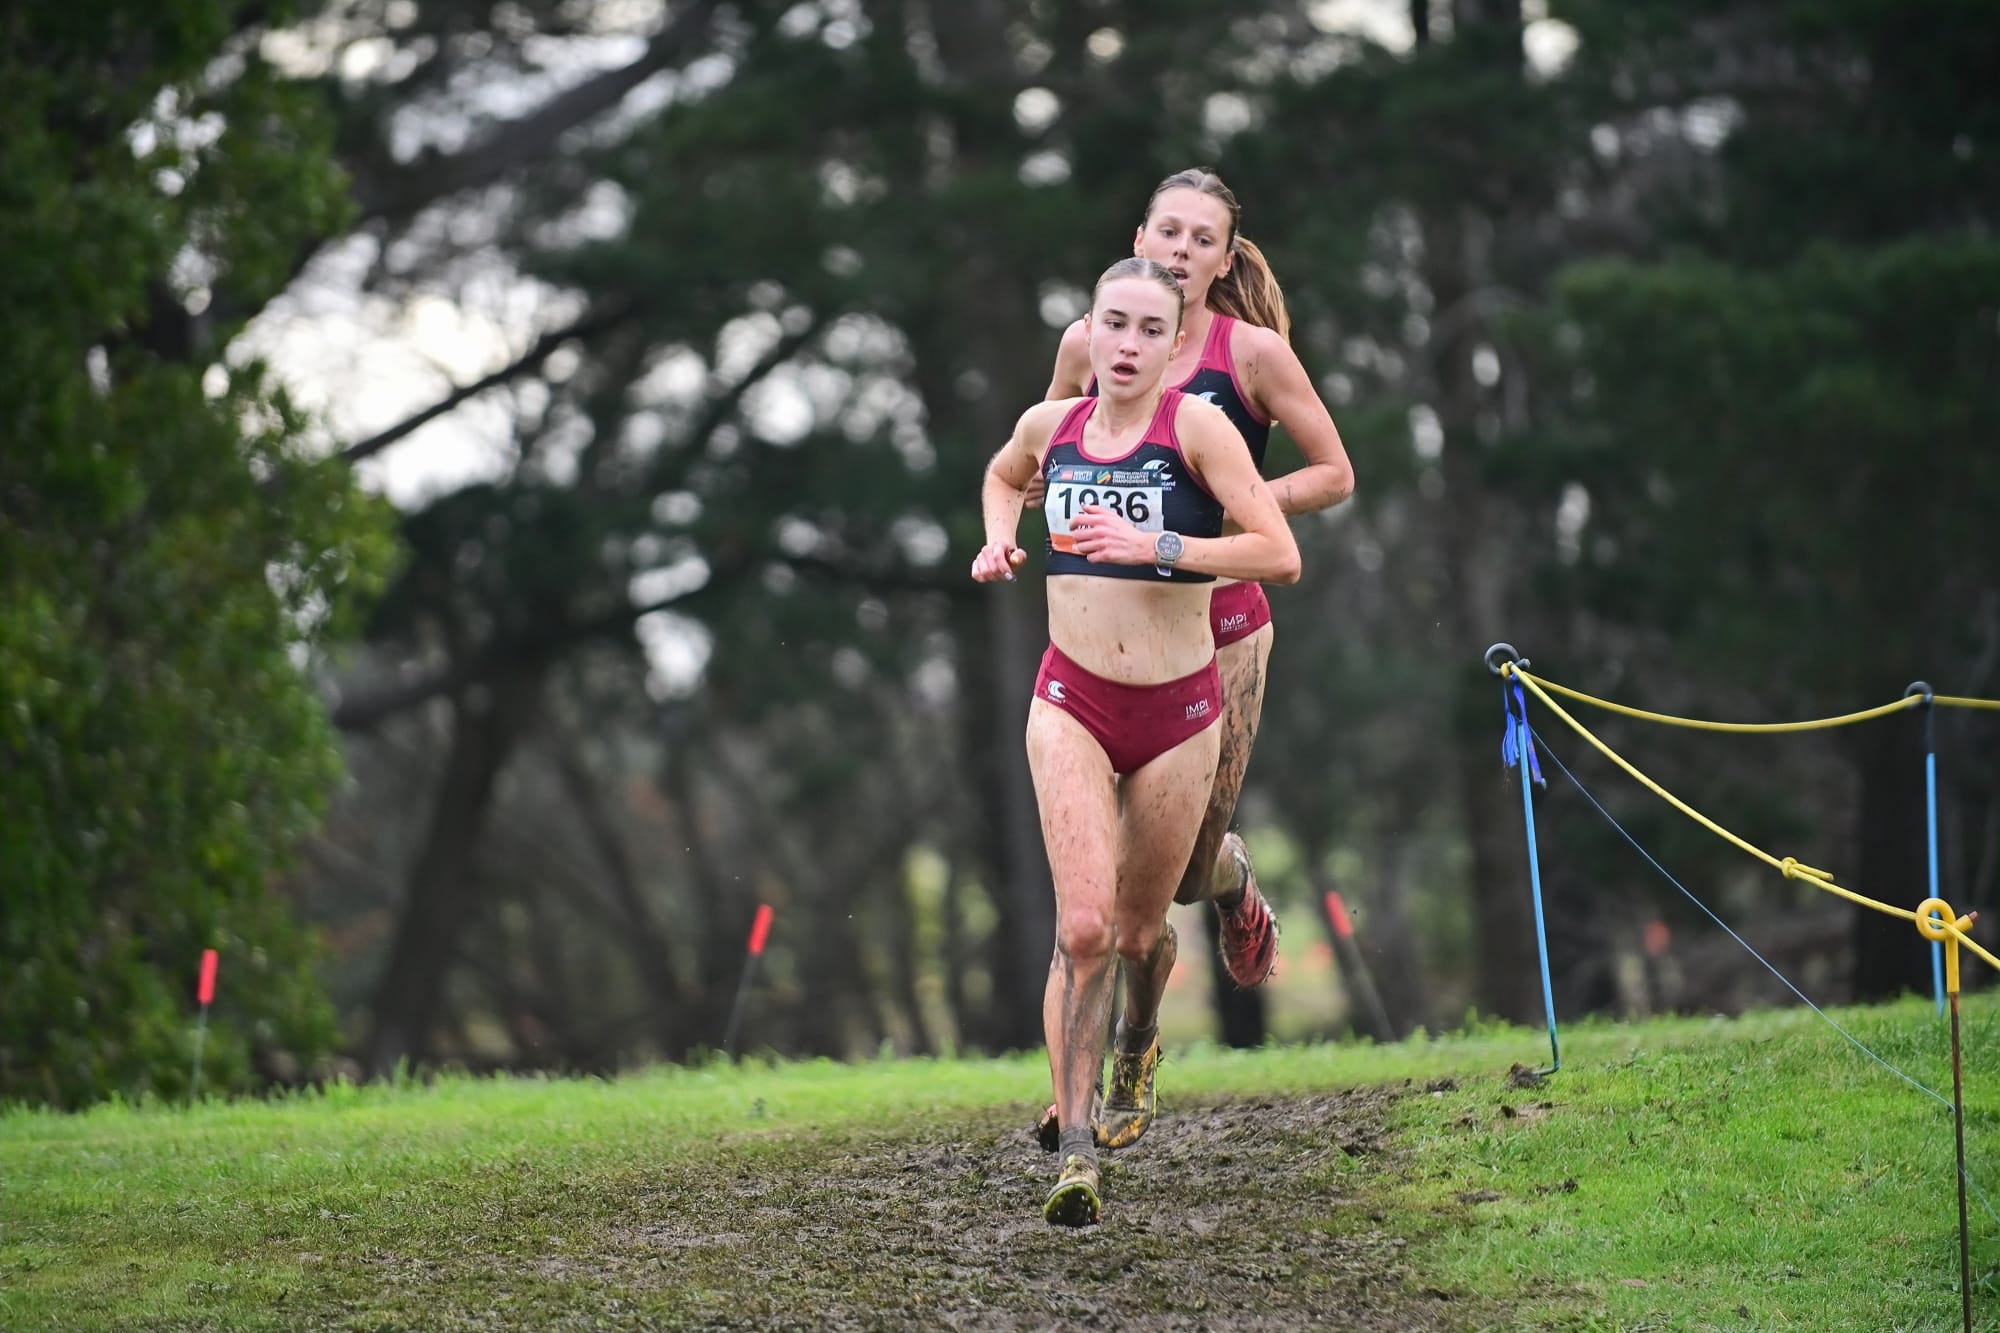
In the U20 women’s race, Milla Roberts’s only recorded reading is 23:23, labelled 3.9km. It is her 5.9km split: add the twenty-four-second run-in that every other finisher recorded and you get her 23:47 finish exactly. Isabella Valinoti — the defending champion — has a 1.9km reading and nothing else, but we know that the top two went clear after the opening loop and finished thirty-seven seconds up on the field.
A caution belongs on the pathway percentages, too. The mud did not tax every race equally: the men’s winning time was 5.5% down on last year’s and the women’s 10.3%. Different course, different athletes, so that is not a clean comparison — but it is enough to say those gap figures belong to this day and this ground. The internal comparison holds, because every race ran the same loops within an hour of each other.
And the final mat is also not a kick detector. Every finisher in every race covered it to the line in 17 to 26 seconds — almost exactly 100 metres at their own average pace. There was generally no sprint finish through the quagmire to the line.
Strintzos won a national title by six seconds in a time he’d run in training over normal ground. Campbell won hers on one loop out of five. Valinoti ran three minutes slower than a year ago and it told you nothing about her competitiveness. Seventy per cent of both open fields sped up on the last lap while seven of the top ten men slowed down. A fourteen-year-old was the fastest girl in the country over four kilometres. Half the senior men’s field was under 23.
Most of the story isn’t in the finishing result, but what the data from the mats tells us.
What the medal table tells us
Finishing times in cross country races are irrelevant, but a medal is forever.
Victoria topped a medal tally which saw medallists from every state and territory, except of the NT.
| Gold | Silver | Bronze | Total | |
| Victoria | 9 | 6 | 6 | 21 |
| NSW | 6 | 5 | 8 | 19 |
| Queensland | 5 | 5 | 3 | 13 |
| SA | 1 | 1 | 3 | 5 |
| TAS | 0 | 2 | 0 | 2 |
| ACT | 0 | 1 | 1 | 2 |
| WA | 0 | 1 | 0 | 1 |
| Non-Australian: | ||||
| NZL | 0 | 2 | 5 | 7 |
| ETH | 0 | 1 | 0 | 1 |
* Medal tally for all events except for Masters